Beats 系列之 Metricbeat

所需环境⌗
- Elasticsearch
- Kibana
- Linux
- Metricbeat
Elasticsearch 的相关文章请参照我的博客《Elastic Stack 之 Elasticsearch》 Kibana 的相关文章请参照我的博客《Elastic Stack 之 Kibana》
如果你已经安装好了 Elasticsearch 和 Kibana,那么可以直接进入 Kibana,并访问 /app/kibana#/home/tutorial/dockerMetrics(这里我要监控的是 Docker ),根据安装步骤进行快速安装。
如果在第三步遇到了问题请看 遇到的坑
安装 Metricbeat⌗
官方支持 yum、apt-get、homebrew 和 下载二进制可执行文件,具体可以参考官方文档。
deb⌗
$ curl -L -O https://artifacts.elastic.co/downloads/beats/metricbeat/metricbeat-7.4.2-amd64.deb
$ sudo dpkg -i metricbeat-7.4.2-amd64.deb
rpm⌗
$ curl -L -O https://artifacts.elastic.co/downloads/beats/metricbeat/metricbeat-7.4.2-x86_64.rpm
$ sudo rpm -vi metricbeat-7.4.2-x86_64.rpm
macOS⌗
$ curl -L -O https://artifacts.elastic.co/downloads/beats/metricbeat/metricbeat-7.4.2-darwin-x86_64.tar.gz
$ tar xzvf metricbeat-7.4.2-darwin-x86_64.tar.gz
# 或者使用 Homebrew
$ brew tap elastic/tap
$ brew install elastic/tap/metricbeat-full
Docker⌗
$ docker pull docker.elastic.co/beats/metricbeat:7.4.2
other⌗
curl -L -O https://artifacts.elastic.co/downloads/beats/metricbeat/metricbeat-7.4.2-linux-x86_64.tar.gz
tar xzvf metricbeat-7.4.2-linux-x86_64.tar.gz
配置 Metricbeat⌗
因为我使用的是 RPM 包,所以安装好以后会自动创建 /etc/metricbeat/metricbeat.yml 和 Systemd Unit 文件。另外 Metricbeat 以模块的形式来集成了常用的服务监控模和模板,可以使用如下命令去查看:
$ metricbeat modules list
或者在 Kibana 上访问 /app/kibana#/home/tutorial_directory/metrics 进行查看所支持的 Modules。

开启模块⌗
你可以通过命令的方式来开启模块:
$ metricbeat modules enable apache mysql
也可以通过在配置文件中添加配置项来开启(如果你不想自定义,到此已经可以了,下面将是冗长的配置说明):
metricbeat.modules:

#---------------------------- Apache Status Module ---------------------------
- module: apache
  metricsets: ["status"]
  period: 1s
  hosts: ["http://127.0.0.1/"]

#---------------------------- MySQL Status Module ----------------------------
- module: mysql
  metricsets: ["status"]
  period: 2s
  hosts: ["root@tcp(127.0.0.1:3306)/"]
period 参数为间隔周期, metricsets 参数为要获取的度量指标
更多有关度量指标的内容请参考官方文档 更多配置参数请参考官方文档
队列⌗
队列用于缓冲获取的度量指标,当达到一定数值后将批量输出到对应的输出端,如 Elasticsearch、Logstash 等
queue.mem:
  events: 4096
  flush.min_events: 512
  flush.timeout: 5s
- events:配置内存中可容纳的事件数量;
- flush.min_events:触发刷新的最小事件数量;
- flush.timeout:刷新的最大等待时间。
更多队列配置请参考官方文档。
输出⌗
Metricbeat 支持的输出端有:
- Elasticsearch
- Logstash
- Kafka
- Redis
- File
- Console
- Elastic Cloud
我这里直接输出到 Elasticsearch,
output.elasticsearch:
  # Array of hosts to connect to.
  hosts: ["https://elasticsearch:9002"]

  # 设置索引的命名规则
  index: "metricbeat-%{[agent.version]}-%{+yyyy.MM.dd}",

  # 采用的协议,如果 hosts 里未声明 schema,这需要在这里声明
  protocol: "https"

  # 如果开启了验证,可以使用如下两项
  # username: "elastic"
  # password: "changeme"

  # 设置请求参数
  # parameters:

  # 如果 Elasticsearch 是被反向代理,且不是`/`路径的话,需要配置该参数
  # path:

  # 设置请求头
  # headers:

  # 设置连接到 Elasticsearch 时的代理 host[:port]
  # proxy_url: https:proxy.com

  # 压缩级别,0为不压缩,1~9 数值越大,压缩比越高,但是越耗费 CPU
  # compression_level: 1

  # 是否转译 HTML
  # escape_html: false

  # 运行的 Worker 数量,默认值为 1
  # worker: 1

  # 用于配置索引规则的数组
  # indices:

  # 索引声明周期设置,请参考 https://www.elastic.co/guide/en/beats/metricbeat/7.4/ilm.html
  # ilm:

  # 流水线设置
  # pipeline:

  # 多个流水线设置
  # pipelines:

  # 最大尝试次数
  # max_retries:

  # 在一次请求中最大处理的事件数,默认是 50,该值的设置取决于实际环境,虽然批量处理可以一定程度提高性能,但是如果设置的过大,将导致 API 请求超时、连接终止并并最终导致吞吐量降低,如果将该值设为 0 将根据队列的设置,决定事件数量。
  # bulk_max_size:

  # 网络错误后尝试重新连接到 Elasticsearch 之前等待的秒数。
  # backoff.init:

  # 网络错误后尝试连接到 Elasticsearch 之前要等待的最大秒数。默认是60度。
  # backoff.max:

  # 请求超时时间
  # timeout:

  # 连接 ssl 配置请参考 https://www.elastic.co/guide/en/beats/metricbeat/7.4/configuration-ssl.html
  # ssl:
更多配置文件设置请参考 https://www.elastic.co/guide/en/beats/metricbeat/7.4/metricbeat-reference-yml.html
迁移⌗
在运行之前需要通过 Metricbeat 根据对应的索引模板生成索引和 Kibana 仪表盘。
$ metricbeat setup -e
-e 参数用于显示日志信息。
遇到的坑⌗
因为我是通过 Nginx 反向代理 Elasticsearch 的,但是因为配置中将 proxy_pass 的值设置设置成了 http://elasticsearch:9200/ 导致出现如下错误:
$ metricbeat setup
Exiting: failed to create alias: {"error":"Incorrect HTTP method for uri [/<metricbeat-7.4.2-{now/d}-000001>] and method [PUT], allowed: [POST]","status":405}: 405 Method Not Allowed: {"error":"Incorrect HTTP method for uri [/<metricbeat-7.4.2-{now/d}-000001>] and method [PUT], allowed: [POST]","status":405}
需要将 http://elasticsearch:9200/ 改成 http://elasticsearch:9200。
运行⌗
$ sudo systemctl stop metricbeat
Docker⌗
$ docker run --net="host" docker.elastic.co/beats/metricbeat:7.4.2 setup -e \
  -E output.logstash.enabled=false \
  -E output.elasticsearch.hosts=['elasticsearch:9200'] \
  -E output.elasticsearch.username=metricbeat_internal \
  -E output.elasticsearch.password=YOUR_PASSWORD \
  -E setup.kibana.host=localhost:5601
在 Kibana 中查看⌗
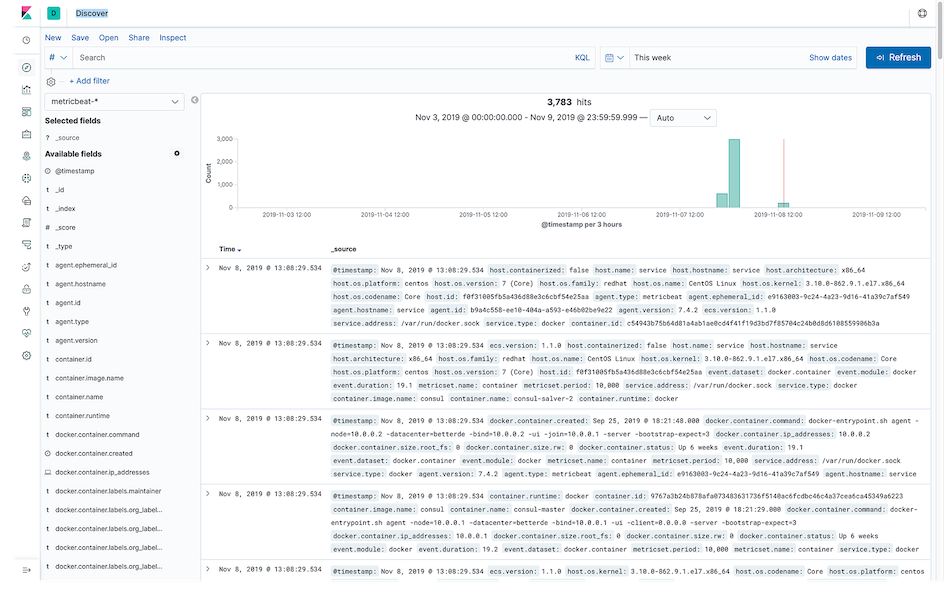
Discover⌗
进入 Discover 页面,在左侧下拉列表中选取 metricbeat-*,效果如下图:
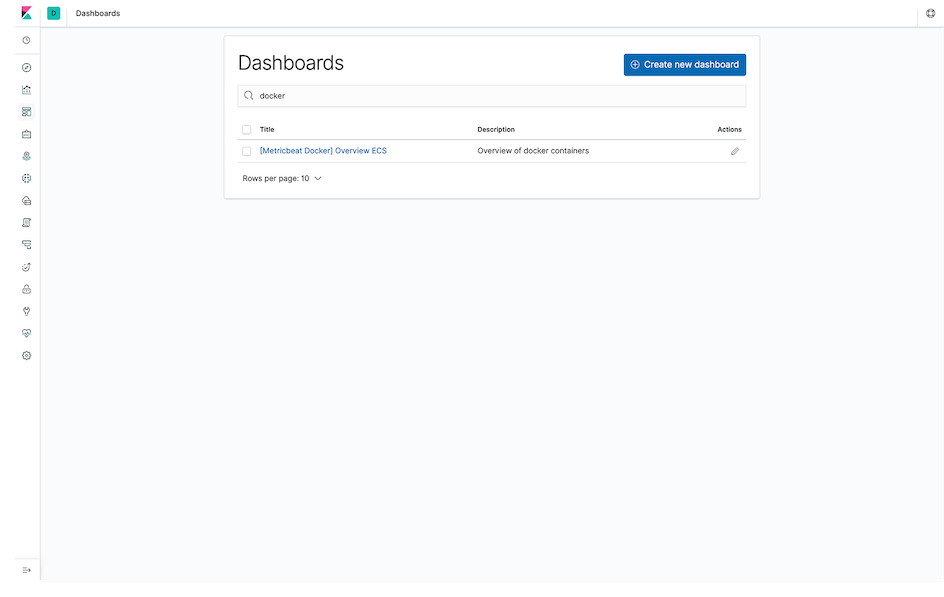
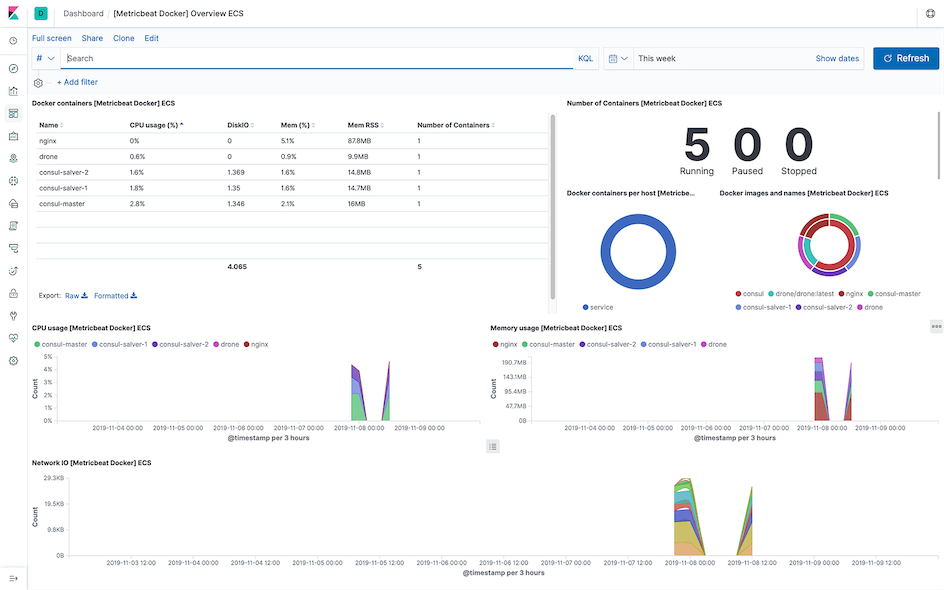
Dashboards⌗
I hope this is helpful, Happy hacking…