Replacing PHP-FPM with Nginx Unit

Introduction⌗
Nginx Unit is another masterpiece developed by the Nginx team. Perhaps no one understands better than them how to balance performance and usability between Nginx and Unit.
Indeed, Unit’s most important feature is Flexibility. You can dynamically modify Unit’s runtime configuration using RESTful APIs. When updating configurations, as long as you clearly know what you’re doing, you can ensure zero service interruption.
Most importantly, it implements SAPI, which can replace PHP-FPM’s important position in PHP. Looking at evaluation articles from a few years ago online, it shows several performance advantages compared to PHP-FPM.
So I plan to use Nginx Unit + PHP 8.1 to conduct a comparative performance test.
Building the Runtime Environment⌗
I’m using Docker to build and deploy the Unit service. In the Dockerfile, I installed the MongoDB extension and PHPRedis extension, both using the latest versions.
Dockerfile
FROM php:8.1-cli as BUILDER

LABEL maintainer="NGINX Docker Maintainers <[email protected]>"

RUN set -ex \
    && apt-get update \
    && apt-get install --no-install-recommends --no-install-suggests -y ca-certificates mercurial build-essential libssl-dev libpcre2-dev \
    && mkdir -p /usr/lib/unit/modules /usr/lib/unit/debug-modules \
    && hg clone https://hg.nginx.org/unit \
    && cd unit \
    && hg up 1.26.1 \
    && NCPU="$(getconf _NPROCESSORS_ONLN)" \
    && DEB_HOST_MULTIARCH="$(dpkg-architecture -q DEB_HOST_MULTIARCH)" \
    && CC_OPT="$(DEB_BUILD_MAINT_OPTIONS="hardening=+all,-pie" DEB_CFLAGS_MAINT_APPEND="-Wp,-D_FORTIFY_SOURCE=2 -fPIC" dpkg-buildflags --get CFLAGS)" \
    && LD_OPT="$(DEB_BUILD_MAINT_OPTIONS="hardening=+all,-pie" DEB_LDFLAGS_MAINT_APPEND="-Wl,--as-needed -pie" dpkg-buildflags --get LDFLAGS)" \
    && CONFIGURE_ARGS="--prefix=/usr \
                --state=/var/lib/unit \
                --control=unix:/var/run/control.unit.sock \
                --pid=/var/run/unit.pid \
                --log=/var/log/unit.log \
                --tmp=/var/tmp \
                --user=unit \
                --group=unit \
                --openssl \
                --libdir=/usr/lib/$DEB_HOST_MULTIARCH" \
    && ./configure $CONFIGURE_ARGS --cc-opt="$CC_OPT" --ld-opt="$LD_OPT" --modules=/usr/lib/unit/debug-modules --debug \
    && make -j $NCPU unitd \
    && install -pm755 build/unitd /usr/sbin/unitd-debug \
    && make clean \
    && ./configure $CONFIGURE_ARGS --cc-opt="$CC_OPT" --ld-opt="$LD_OPT" --modules=/usr/lib/unit/modules \
    && make -j $NCPU unitd \
    && install -pm755 build/unitd /usr/sbin/unitd \
    && make clean \
    && ./configure $CONFIGURE_ARGS --cc-opt="$CC_OPT" --modules=/usr/lib/unit/debug-modules --debug \
    && ./configure php \
    && make -j $NCPU php-install \
    && make clean \
    && ./configure $CONFIGURE_ARGS --cc-opt="$CC_OPT" --modules=/usr/lib/unit/modules \
    && ./configure php \
    && make -j $NCPU php-install \
    && ldd /usr/sbin/unitd | awk '/=>/{print $(NF-1)}' | while read n; do dpkg-query -S $n; done | sed 's/^\([^:]\+\):.*$/\1/' | sort | uniq > /requirements.apt

FROM php:8.1-cli
COPY docker-entrypoint.sh /usr/local/bin/
COPY --from=BUILDER /usr/sbin/unitd /usr/sbin/unitd
COPY --from=BUILDER /usr/sbin/unitd-debug /usr/sbin/unitd-debug
COPY --from=BUILDER /usr/lib/unit/ /usr/lib/unit/
COPY --from=BUILDER /requirements.apt /requirements.apt
RUN ldconfig
RUN set -x \
    && mkdir -p /var/lib/unit/ \
    && mkdir /docker-entrypoint.d/ \
    && addgroup --system unit \
    && adduser \
         --system \
         --disabled-login \
         --ingroup unit \
         --no-create-home \
         --home /nonexistent \
         --gecos "unit user" \
         --shell /bin/false \
         unit \
    && apt-get update \
    && apt-get upgrade -y \
    && apt-get --no-install-recommends --no-install-suggests -y install git libzip-dev zip openssl libssl-dev libcurl4-openssl-dev curl $(cat /requirements.apt) \
    && docker-php-ext-install zip \
    && pecl install lzf \
    && pecl install igbinary \
    && pecl install redis \
    && pecl install mongodb \
    && docker-php-ext-enable lzf igbinary redis mongodb \
    && docker-php-ext-install pcntl \
    && docker-php-ext-install pdo_mysql \
    && docker-php-ext-install opcache \
    && docker-php-ext-install exif \
    && apt-get clean && rm -rf /var/lib/apt/lists/* /tmp/* /var/tmp/* \
    && rm -f /requirements.apt \
    && rm /var/log/lastlog /var/log/faillog \
    && ln -sf /dev/stdout /var/log/unit.log

# Install Composer
RUN php -r "copy('https://getcomposer.org/installer', 'composer-setup.php');" && \
    EXPECTED_CHECKSUM="$(php -r 'copy("https://composer.github.io/installer.sig", "php://stdout");')" && \
    php -r "if (hash_file('sha384', 'composer-setup.php') === '$EXPECTED_CHECKSUM') { echo 'Installer verified'; } else { echo 'Installer corrupt'; unlink('composer-setup.php'); } echo PHP_EOL;" && \
    php composer-setup.php && \
    php -r "unlink('composer-setup.php');" && \
    mv composer.phar /usr/local/bin/composer && \
    chmod +x /usr/local/bin/composer

# Configure locale.
ARG LOCALE=POSIX
ENV LC_ALL ${LOCALE}

STOPSIGNAL SIGTERM

ENTRYPOINT ["/usr/local/bin/docker-entrypoint.sh"]

CMD ["unitd", "--no-daemon", "--control", "unix:/var/run/control.unit.sock"]
docker-compose.yml
version: "3.8"

services:
  unit:
  image: unit/php:laravel
  build:
    context: .
    dockerfile: Dockerfile
  working_dir: /usr/wwwroot/projects
  restart: always
  hostname: unit
  container_name: unit
  ports:
    - 80:80
    - 443:443
  networks:
    - services
  volumes:
    - ./projects:/usr/wwwroot/projects:rw
    - ./services/php/8.1/etc:/usr/local/etc
networks:
  services:
    name: services
    ipam:
      driver: default
      config:
        - subnet: 10.0.8.0/24
projects/phpinfo/index.php
<?php
phpinfo();
Building the Image⌗
The directory structure after completing the configuration files is as follows:
$ tree -L 3
.
├── Dockerfile
├── docker-compose.yml
├── docker-entrypoint.sh
├── php
│   └── etc
│       ├── pear.conf
│       └── php
└── projects
    └── phpinfo
        └── index.php

15 directories, 12 files
I’ve already put the project on Github, you can clone it if needed.
$ docker-compose up -d
Configuring Unit⌗
{
    "listeners": {
        "*:80": {
            "pass": "routes"
        }
    },
    "routes": [
        {
            "match": {
                "uri": "!/index.php"
            },
            "action": {
                "share": "/usr/wwwroot/projects/phpinfo$uri",
                "fallback": {
                    "pass": "applications/laravel"
                }
            }
        }
    ],
    "applications": {
        "laravel": {
            "type": "php",
            "processes": {
                "max": 120,
                "spare": 5,
                "idle_timeout": 20
            },
            "root": "/usr/wwwroot/projects/phpinfo/",
            "script": "index.php"
        }
    }
}
Compress the above JSON object into a string, then execute the command below to send the configuration file to Unit.
$ docker exec -it laravel curl -X PUT -d '{"listeners":{"*:80":{"pass":"routes"}},"routes":[{"match":{"uri":"!/index.php"},"action":{"share":"/usr/wwwroot/projects/phpinfo$uri","fallback":{"pass":"applications/laravel"}}}],"applications":{"laravel":{"type":"php","processes":{"max":120,"spare":5,"idle_timeout":20},"root":"/usr/wwwroot/projects/phpinfo/","script":"index.php"}}}' --unix-socket /var/run/control.unit.sock http://localhost/config/
If executed successfully, it will return:
{
  "success": "Reconfiguration done."
}
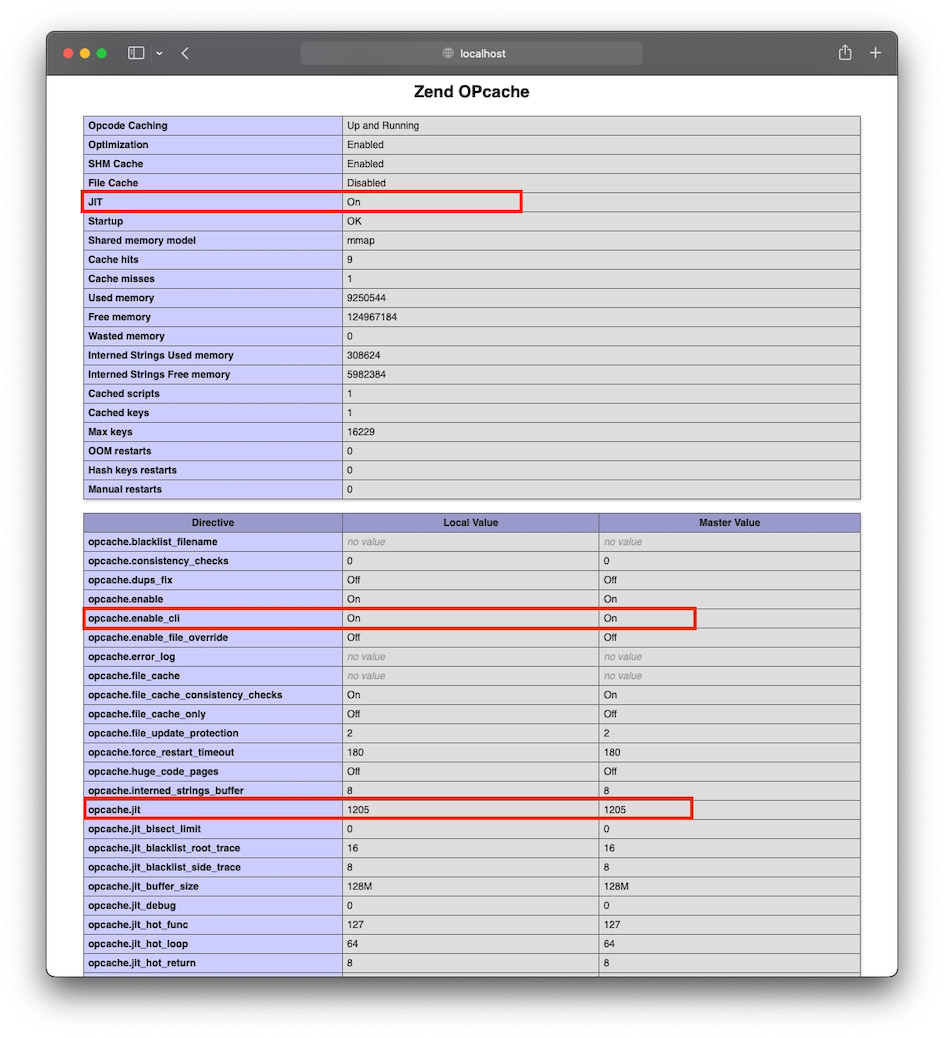
Then access http://localhost to open the phpinfo page.
Performance Comparison⌗
Hardware Configuration⌗
4 cores/8GB network with 100Mbps bandwidth peak, disk is ESSD 40G (2280 IOPS).
Service Configuration⌗
Benchmarking Unit + PHP 8.1.1⌗
ab -n 10000 -c 20 "http://47.100.202.147:8080/"

Server Software:        Unit/1.26.1
Server Hostname:        47.100.202.147
Server Port:            8080

Document Path:          /
Document Length:        17592 bytes

Concurrency Level:      20
Time taken for tests:   73.888 seconds
Complete requests:      10000
Failed requests:        0
Total transferred:      187050000 bytes
HTML transferred:       175920000 bytes
Requests per second:    135.34 [#/sec] (mean)
Time per request:       147.775 [ms] (mean)
Time per request:       7.389 [ms] (mean, across all concurrent requests)
Transfer rate:          2472.22 [Kbytes/sec] received

Connection Times (ms)
              min  mean[+/-sd] median   max
Connect:        6    9   1.3      9      24
Processing:    17  136 716.7     34    5985
Waiting:       10  127 716.7     25    5977
Total:         24  145 716.7     43    5992

Percentage of the requests served within a certain time (ms)
  50%     43
  66%     48
  75%     51
  80%     53
  90%     57
  95%     62
  98%     90
  99%   5230
 100%   5992 (longest request)
ab -n 10000 -c 50 "http://47.100.202.147:8080/"

Server Software:        Unit/1.26.1
Server Hostname:        47.100.202.147
Server Port:            8080

Document Path:          /
Document Length:        17592 bytes

Concurrency Level:      50
Time taken for tests:   61.516 seconds
Complete requests:      10000
Failed requests:        0
Total transferred:      187050000 bytes
HTML transferred:       175920000 bytes
Requests per second:    162.56 [#/sec] (mean)
Time per request:       307.580 [ms] (mean)
Time per request:       6.152 [ms] (mean, across all concurrent requests)
Transfer rate:          2969.41 [Kbytes/sec] received

Connection Times (ms)
              min  mean[+/-sd] median   max
Connect:        6   10   4.4      9     151
Processing:    20  285 1350.1     99   11801
Waiting:       12  272 1350.4     85   11792
Total:         28  295 1350.1    109   11810

Percentage of the requests served within a certain time (ms)
  50%    109
  66%    119
  75%    127
  80%    132
  90%    145
  95%    156
  98%    198
  99%  10018
 100%  11810 (longest request)
ab -n 10000 -c 100 "http://47.100.202.147:8080/"

Server Software:        Unit/1.26.1
Server Hostname:        47.100.202.147
Server Port:            8080

Document Path:          /
Document Length:        17592 bytes

Concurrency Level:      100
Time taken for tests:   57.325 seconds
Complete requests:      10000
Failed requests:        0
Total transferred:      187050000 bytes
HTML transferred:       175920000 bytes
Requests per second:    174.45 [#/sec] (mean)
Time per request:       573.247 [ms] (mean)
Time per request:       5.732 [ms] (mean, across all concurrent requests)
Transfer rate:          3186.52 [Kbytes/sec] received

Connection Times (ms)
              min  mean[+/-sd] median   max
Connect:        6   14  10.7     10      79
Processing:    22  515 2178.1    210   18381
Waiting:       13  493 2179.3    190   18364
Total:         31  528 2177.9    223   18394

Percentage of the requests served within a certain time (ms)
  50%    223
  66%    254
  75%    266
  80%    273
  90%    293
  95%    305
  98%    365
  99%  16907
 100%  18394 (longest request)
Benchmarking Nginx + PHP-FPM + PHP 8.1.1⌗
ab -n 10000 -c 20 "http://47.100.202.147:8081/"

Server Software:        nginx
Server Hostname:        47.100.202.147
Server Port:            8081

Document Path:          /
Document Length:        17592 bytes

Concurrency Level:      20
Time taken for tests:   76.832 seconds
Complete requests:      10000
Failed requests:        0
Total transferred:      187160000 bytes
HTML transferred:       175920000 bytes
Requests per second:    130.15 [#/sec] (mean)
Time per request:       153.663 [ms] (mean)
Time per request:       7.683 [ms] (mean, across all concurrent requests)
Transfer rate:          2378.88 [Kbytes/sec] received

Connection Times (ms)
              min  mean[+/-sd] median   max
Connect:        6    9   1.2      9      27
Processing:    18  141 724.5     39    6025
Waiting:       11  132 724.5     30    6016
Total:         24  150 724.5     48    6035

Percentage of the requests served within a certain time (ms)
  50%     48
  66%     52
  75%     54
  80%     56
  90%     61
  95%     66
  98%     95
  99%   5314
 100%   6035 (longest request)
ab -n 10000 -c 50 "http://47.100.202.147:8081/"

Server Software:        nginx
Server Hostname:        47.100.202.147
Server Port:            8081

Document Path:          /
Document Length:        17592 bytes

Concurrency Level:      50
Time taken for tests:   80.285 seconds
Complete requests:      10000
Failed requests:        0
Total transferred:      187160000 bytes
HTML transferred:       175920000 bytes
Requests per second:    124.56 [#/sec] (mean)
Time per request:       401.426 [ms] (mean)
Time per request:       8.029 [ms] (mean, across all concurrent requests)
Transfer rate:          2276.55 [Kbytes/sec] received

Connection Times (ms)
              min  mean[+/-sd] median   max
Connect:        6    9   3.9      9     177
Processing:    19  375 1973.8    100   16940
Waiting:       11  362 1974.2     88   16931
Total:         26  384 1973.8    109   16950

Percentage of the requests served within a certain time (ms)
  50%    109
  66%    124
  75%    134
  80%    139
  90%    150
  95%    162
  98%    331
  99%  15107
 100%  16950 (longest request)
ab -n 10000 -c 100 "http://47.100.202.147:8081/"

Server Software:        nginx
Server Hostname:        47.100.202.147
Server Port:            8081

Document Path:          /
Document Length:        17592 bytes

Concurrency Level:      100
Time taken for tests:   94.577 seconds
Complete requests:      10000
Failed requests:        0
Total transferred:      187160000 bytes
HTML transferred:       175920000 bytes
Requests per second:    105.73 [#/sec] (mean)
Time per request:       945.768 [ms] (mean)
Time per request:       9.458 [ms] (mean, across all concurrent requests)
Transfer rate:          1932.54 [Kbytes/sec] received

Connection Times (ms)
              min  mean[+/-sd] median   max
Connect:        6   13   9.7      9     114
Processing:    22  862 4350.7    226   35655
Waiting:       13  842 4352.0    207   35643
Total:         30  875 4350.6    239   35663

Percentage of the requests served within a certain time (ms)
  50%    239
  66%    277
  75%    297
  80%    307
  90%    329
  95%    346
  98%  19222
  99%  32654
 100%  35663 (longest request)
| Service | Concurrency | Requests per second | Time per request |
|---|---|---|---|
| Unit+PHP 8.1 | 20 | 135.34 | 7.389 |
| Unit+PHP 8.1 | 50 | 162.56 | 6.152 |
| Unit+PHP 8.1 | 100 | 174.45 | 5.732 |
| Nginx+PHP-FPM | 20 | 130.15 | 7.683 |
| Nginx+PHP-FPM | 40 | 124.56 | 8.029 |
| Nginx+PHP-FPM | 100 | 105.73 | 9.458 |
Looking at the data above, the performance difference isn’t as large as imagined, but Unit shows an upward performance trend as concurrency increases, which is interesting. Perhaps this level of concurrency isn’t enough to fully utilize Unit.
Local Testing⌗
Considering it might be due to my local network, I also conducted local tests directly on the server:
ab -n 10000 -c 100 "http://127.0.0.1:8080/"

Server Software:        Unit/1.26.1
Server Hostname:        127.0.0.1
Server Port:            8080

Document Path:          /
Document Length:        17592 bytes

Concurrency Level:      100
Time taken for tests:   99.609 seconds
Complete requests:      10000
Failed requests:        0
Total transferred:      187050000 bytes
HTML transferred:       175920000 bytes
Requests per second:    100.39 [#/sec] (mean)
Time per request:       996.091 [ms] (mean)
Time per request:       9.961 [ms] (mean, across all concurrent requests)
Transfer rate:          1833.83 [Kbytes/sec] received

Connection Times (ms)
             min  mean[+/-sd] median   max
Connect:        0    0   0.1      0       2
Processing:     4  914 5118.6    240   43107
Waiting:        4  912 5118.5    238   43107
Total:          4  914 5118.6    240   43108

Percentage of the requests served within a certain time (ms)
 50%    240
 66%    274
 75%    295
 80%    306
 90%    335
 95%    369
 98%    460
 99%  39589
100%  43108 (longest request)
ab -n 10000 -c 100 "http://127.0.0.1:8081/"

Server Software:        nginx
Server Hostname:        127.0.0.1
Server Port:            8081

Document Path:          /
Document Length:        17592 bytes

Concurrency Level:      100
Time taken for tests:   92.971 seconds
Complete requests:      10000
Failed requests:        0
Total transferred:      187160000 bytes
HTML transferred:       175920000 bytes
Requests per second:    107.56 [#/sec] (mean)
Time per request:       929.709 [ms] (mean)
Time per request:       9.297 [ms] (mean, across all concurrent requests)
Transfer rate:          1965.92 [Kbytes/sec] received

Connection Times (ms)
              min  mean[+/-sd] median   max
Connect:        0    0   0.2      0       3
Processing:     3  854 4601.4    236   38351
Waiting:        3  854 4601.4    236   38351
Total:          3  854 4601.4    236   38351

Percentage of the requests served within a certain time (ms)
  50%    236
  66%    282
  75%    301
  80%    313
  90%    336
  95%    358
  98%    427
  99%  35636
 100%  38351 (longest request)
Local WRK Benchmark⌗
wrk -t4 -c50 http://localhost:8080

Running 10s test @ http://localhost:8080
 4 threads and 50 connections
 Thread Stats   Avg      Stdev     Max   +/- Stdev
   Latency    81.71ms   43.75ms 234.97ms   66.18%
   Req/Sec    57.10     52.38   252.00     82.73%
 2052 requests in 10.01s, 36.61MB read
Requests/sec:    205.03
Transfer/sec:      3.66MB
wrk -t4 -c50 http://localhost:8081

Running 10s test @ http://localhost:8081
 4 threads and 50 connections
 Thread Stats   Avg      Stdev     Max   +/- Stdev
   Latency    98.90ms   97.57ms 786.41ms   95.98%
   Req/Sec    55.98     52.61   300.00     83.20%
 2099 requests in 10.01s, 37.48MB read
Requests/sec:    209.69
Transfer/sec:      3.74MB
Conclusion⌗
After several tests, I found that the performance of Unit with embedded PHP 8.1 doesn’t seem to differ much from Nginx + PHP 8.1 + PHP-FPM. I’m not sure if this is due to JIT or if Unit with embedded PHP 8.1 with JIT.CLI isn’t effective. One undeniable point is that PHP’s upgrades in recent years have indeed significantly improved performance.
When I have time later, I’ll do tests with Swoole and RoadRunner as well.
I hope this is helpful, Happy hacking…