Beats Series - Metricbeat

Required Environment⌗
- Elasticsearch
- Kibana
- Linux
- Metricbeat
For Elasticsearch related articles, please refer to my blog “Elastic Stack - Elasticsearch” For Kibana related articles, please refer to my blog “Elastic Stack - Kibana”
If you have already installed Elasticsearch and Kibana, you can directly enter Kibana and visit /app/kibana#/home/tutorial/dockerMetrics (here I want to monitor Docker), and follow the installation steps for quick installation.
If you encounter problems in the third step, please see Issues Encountered
Installing Metricbeat⌗
Official support for yum, apt-get, homebrew, and downloading binary executable files is available. For details, please refer to the official documentation.
deb⌗
$ curl -L -O https://artifacts.elastic.co/downloads/beats/metricbeat/metricbeat-7.4.2-amd64.deb
$ sudo dpkg -i metricbeat-7.4.2-amd64.deb
rpm⌗
$ curl -L -O https://artifacts.elastic.co/downloads/beats/metricbeat/metricbeat-7.4.2-x86_64.rpm
$ sudo rpm -vi metricbeat-7.4.2-x86_64.rpm
macOS⌗
$ curl -L -O https://artifacts.elastic.co/downloads/beats/metricbeat/metricbeat-7.4.2-darwin-x86_64.tar.gz
$ tar xzvf metricbeat-7.4.2-darwin-x86_64.tar.gz
# or use Homebrew
$ brew tap elastic/tap
$ brew install elastic/tap/metricbeat-full
Docker⌗
$ docker pull docker.elastic.co/beats/metricbeat:7.4.2
other⌗
curl -L -O https://artifacts.elastic.co/downloads/beats/metricbeat/metricbeat-7.4.2-linux-x86_64.tar.gz
tar xzvf metricbeat-7.4.2-linux-x86_64.tar.gz
Configuring Metricbeat⌗
Since I’m using the RPM package, after installation it will automatically create /etc/metricbeat/metricbeat.yml and the Systemd Unit file. Additionally, Metricbeat integrates commonly used service monitoring modules and templates in a modular form, which can be viewed using the following command:
$ metricbeat modules list
Or visit /app/kibana#/home/tutorial_directory/metrics in Kibana to view the supported Modules.

Enabling Modules⌗
You can enable modules through commands:
$ metricbeat modules enable apache mysql
You can also enable them by adding configuration items in the configuration file (if you don’t want to customize, you’re already done here, the following will be lengthy configuration explanations):
metricbeat.modules:

#---------------------------- Apache Status Module ---------------------------
- module: apache
  metricsets: ["status"]
  period: 1s
  hosts: ["http://127.0.0.1/"]

#---------------------------- MySQL Status Module ----------------------------
- module: mysql
  metricsets: ["status"]
  period: 2s
  hosts: ["root@tcp(127.0.0.1:3306)/"]
The period parameter is the interval period, and the metricsets parameter specifies the metrics to be collected
For more information about metrics, please refer to the official documentation For more configuration parameters, please refer to the official documentation
Queue⌗
Queues are used to buffer collected metrics, which are then output in batches to the corresponding output endpoints, such as Elasticsearch, Logstash, etc., when a certain value is reached.
queue.mem:
  events: 4096
  flush.min_events: 512
  flush.timeout: 5s
- events: Configures the number of events that can be accommodated in memory;
- flush.min_events: The minimum number of events that trigger a flush;
- flush.timeout: The maximum waiting time for a flush.
For more queue configurations, please refer to the official documentation.
Output⌗
Metricbeat supports the following output endpoints:
- Elasticsearch
- Logstash
- Kafka
- Redis
- File
- Console
- Elastic Cloud
Here I’m outputting directly to Elasticsearch,
output.elasticsearch:
  # Array of hosts to connect to.
  hosts: ["https://elasticsearch:9002"]

  # Set the index naming rule
  index: "metricbeat-%{[agent.version]}-%{+yyyy.MM.dd}",

  # Protocol used, if schema is not declared in hosts, it needs to be declared here
  protocol: "https"

  # If authentication is enabled, you can use the following two items
  # username: "elastic"
  # password: "changeme"

  # Set request parameters
  # parameters:

  # If Elasticsearch is behind a reverse proxy and not on the `/` path, this parameter needs to be configured
  # path:

  # Set request headers
  # headers:

  # Set proxy host[:port] when connecting to Elasticsearch
  # proxy_url: https:proxy.com

  # Compression level, 0 for no compression, 1~9 the higher the value, the higher the compression ratio, but the more CPU intensive
  # compression_level: 1

  # Whether to escape HTML
  # escape_html: false

  # Number of Workers to run, default value is 1
  # worker: 1

  # Array for configuring index rules
  # indices:

  # Index lifecycle settings, please refer to https://www.elastic.co/guide/en/beats/metricbeat/7.4/ilm.html
  # ilm:

  # Pipeline settings
  # pipeline:

  # Multiple pipeline settings
  # pipelines:

  # Maximum number of retry attempts
  # max_retries:

  # Maximum number of events processed in a single request, default is 50. The setting of this value depends on the actual environment. Although batch processing can improve performance to some extent, if set too large, it will lead to API request timeouts, connection terminations, and ultimately reduced throughput. If this value is set to 0, the number of events will be determined by the queue settings.
  # bulk_max_size:

  # Number of seconds to wait before trying to reconnect to Elasticsearch after a network error.
  # backoff.init:

  # Maximum number of seconds to wait before attempting to connect to Elasticsearch after a network error. Default is 60 seconds.
  # backoff.max:

  # Request timeout
  # timeout:

  # For ssl connection configuration, please refer to https://www.elastic.co/guide/en/beats/metricbeat/7.4/configuration-ssl.html
  # ssl:
For more configuration file settings, please refer to https://www.elastic.co/guide/en/beats/metricbeat/7.4/metricbeat-reference-yml.html
Migration⌗
Before running, you need to generate indexes and Kibana dashboards according to the corresponding index templates through Metricbeat.
$ metricbeat setup -e
The -e parameter is used to display log information.
Issues Encountered⌗
Because I’m using Nginx to reverse proxy Elasticsearch, but because the proxy_pass value in the configuration was set to http://elasticsearch:9200/, the following error occurred:
$ metricbeat setup
Exiting: failed to create alias: {"error":"Incorrect HTTP method for uri [/<metricbeat-7.4.2-{now/d}-000001>] and method [PUT], allowed: [POST]","status":405}: 405 Method Not Allowed: {"error":"Incorrect HTTP method for uri [/<metricbeat-7.4.2-{now/d}-000001>] and method [PUT], allowed: [POST]","status":405}
You need to change http://elasticsearch:9200/ to http://elasticsearch:9200.
Running⌗
$ sudo systemctl stop metricbeat
Docker⌗
$ docker run --net="host" docker.elastic.co/beats/metricbeat:7.4.2 setup -e \
  -E output.logstash.enabled=false \
  -E output.elasticsearch.hosts=['elasticsearch:9200'] \
  -E output.elasticsearch.username=metricbeat_internal \
  -E output.elasticsearch.password=YOUR_PASSWORD \
  -E setup.kibana.host=localhost:5601
Viewing in Kibana⌗
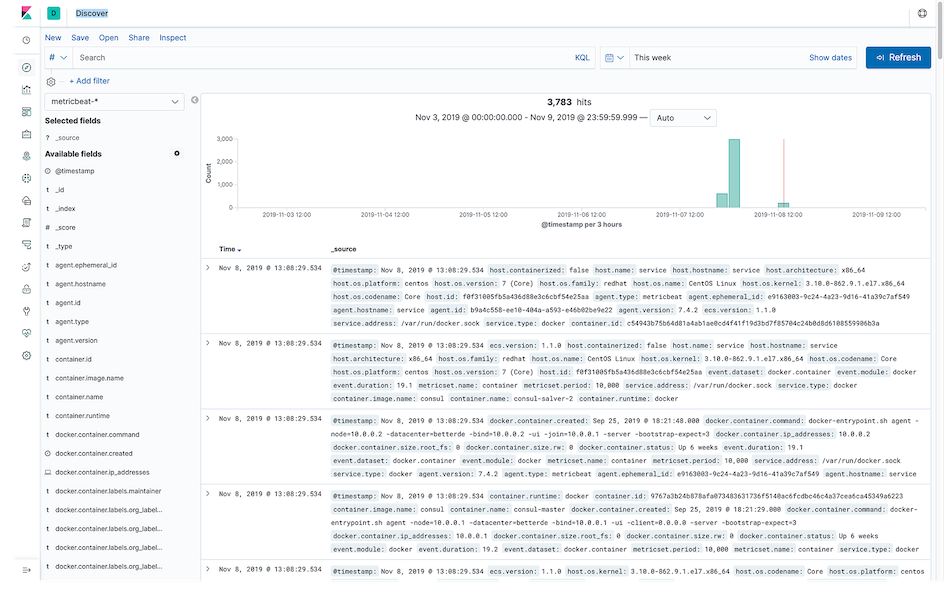
Discover⌗
Enter the Discover page, select metricbeat-* from the dropdown list on the left, the effect is as shown below:
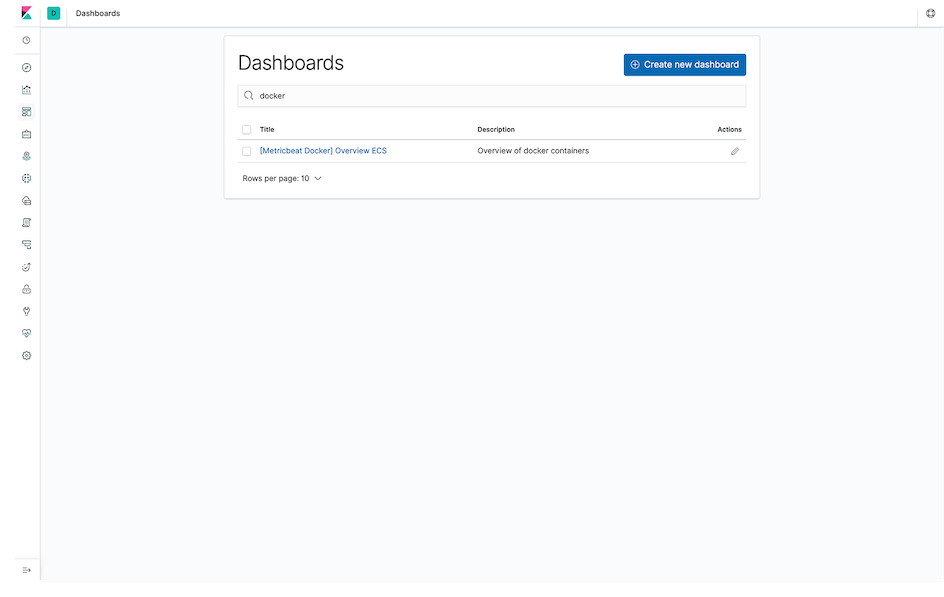
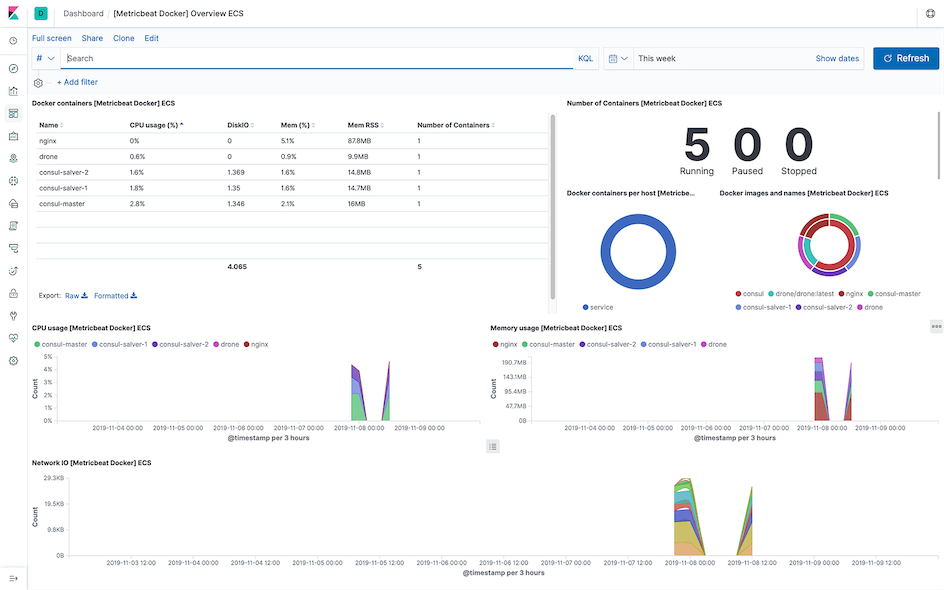
Dashboards⌗
I hope this is helpful, Happy hacking…