Elastic Stack - Kibana

Introduction⌗
Kibana is an open-source data analysis and visualization platform. It is a member of the Elastic Stack, designed to work with Elasticsearch. You can use Kibana to search, view, and interact with data stored in Elasticsearch indices. You can easily analyze and present data in various ways using charts, tables, and maps.
Kibana makes big data easy to understand. It’s simple, browser-based interface allows you to quickly create and share dynamic dashboards that display Elasticsearch’s real-time data changes.
Setting up Kibana is very simple. You can install Kibana in minutes and start exploring Elasticsearch index data — no code, no additional infrastructure required.
Installation⌗
Version⌗
Kibana’s version needs to match the Elasticsearch version. This is the officially supported configuration.
Running Kibana and Elasticsearch with different major versions is not supported (e.g., Kibana 5.x and Elasticsearch 2.x). If the major versions are the same, running a Kibana minor version that is newer than the Elasticsearch minor version is also not supported (e.g., Kibana 5.1 and Elasticsearch 5.0).
Note: Starting from version 6.0, Kibana only supports 64-bit operating systems.
$ docker pull kibana:7.4.2

$ docker run -d \
  --name kibana \
  --net somenetwork \
  -p 5601:5601 \
  -e "ELASTICSEARCH_URL=http://elasticsearch:9200" \
  kibana:7.4.2
Note: The Kibana official image repository no longer supports the latest tag, so you cannot use the
docker pull kibanacommand directly. You must specify a version number when pulling.
Importing Demo Data⌗
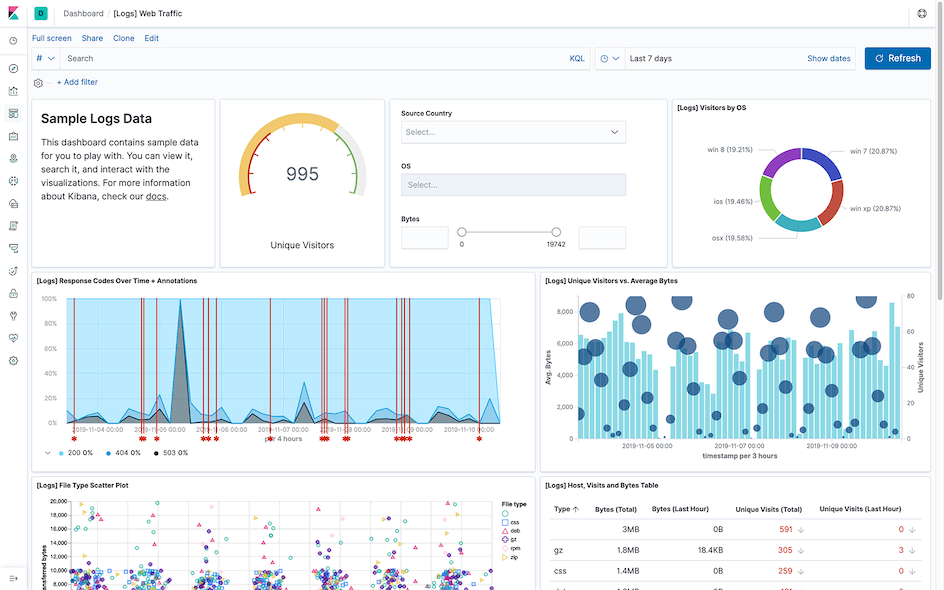
When accessing Kibana for the first time, you will be prompted whether to import demo data:
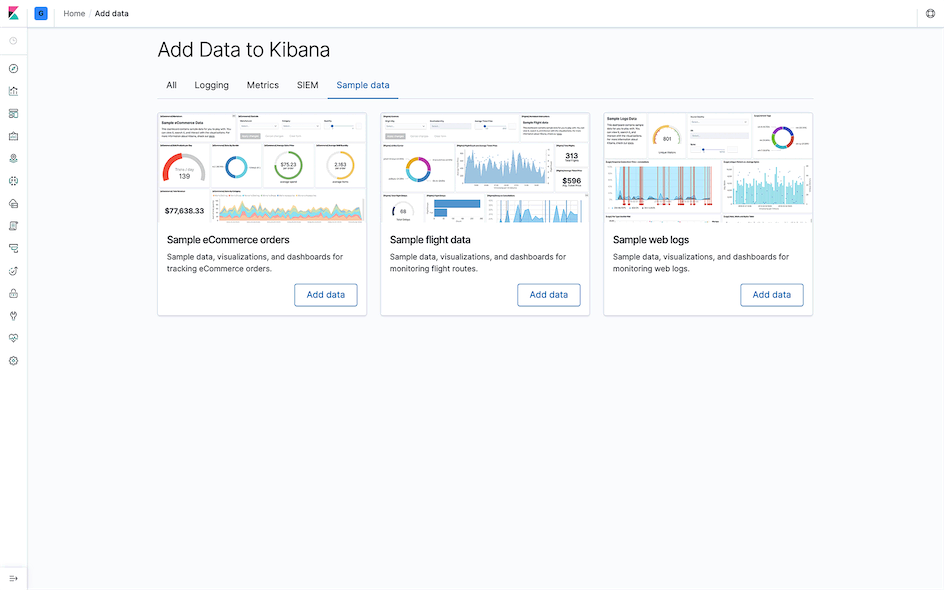
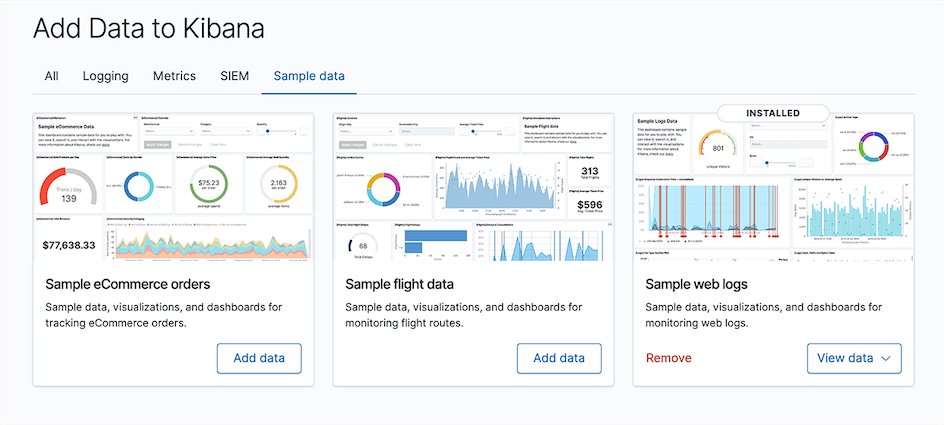
Click the Add data button in the data module you want to import, then click the Dashboard button in the View data dropdown menu after completion (I imported the Sample web logs data here):
Terminology⌗
Space⌗
The new version of Kibana added the Space feature, which is similar to a namespace. Since there is no concept of users in Kibana, I think Space might be designed to distinguish different presentation methods and configurations set by different people for the same data.
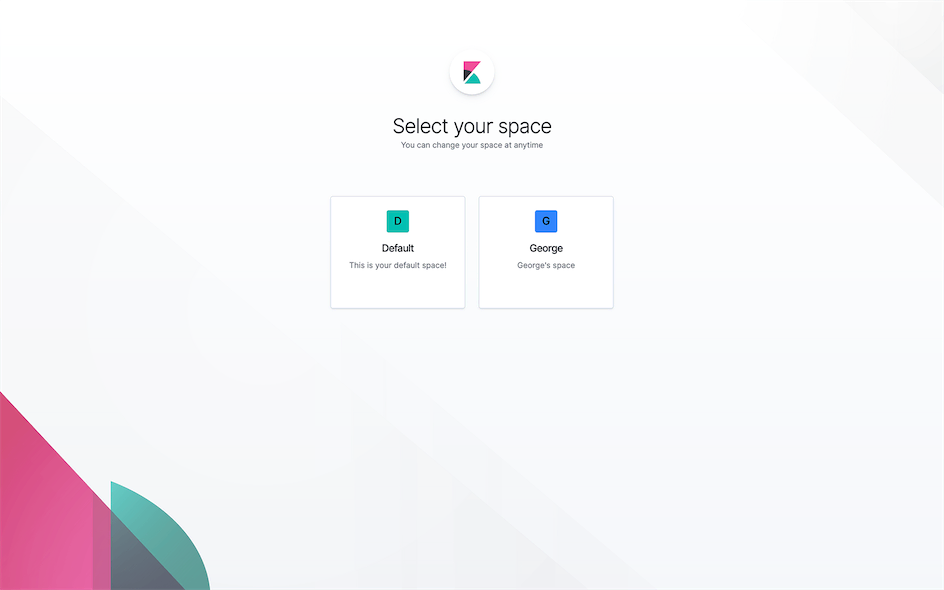
After entering a Space, you can click to switch the current Space to the right of the Logo in the upper left corner of the page.
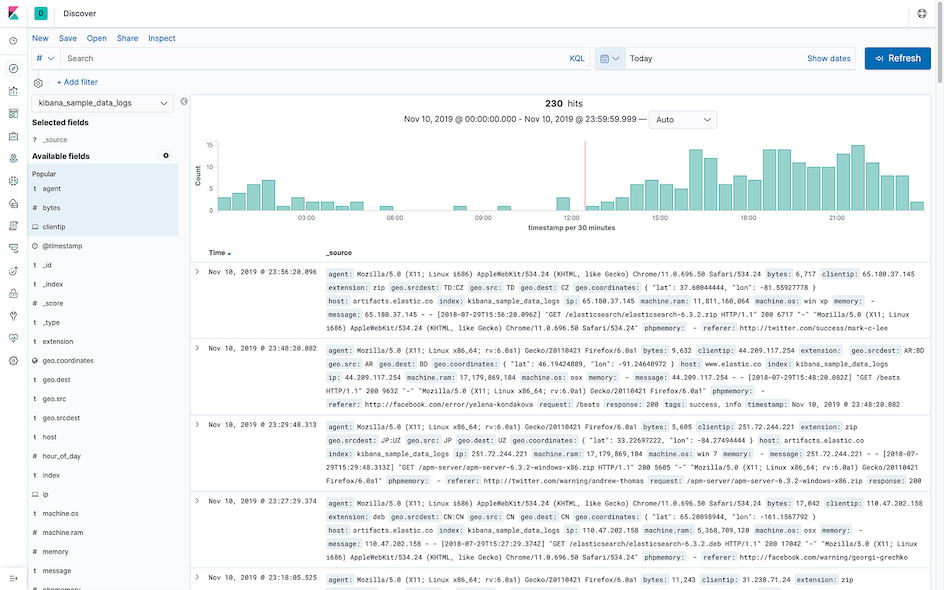
Discover⌗
Interactively explore data in Elasticsearch through queries and filters of raw documents.
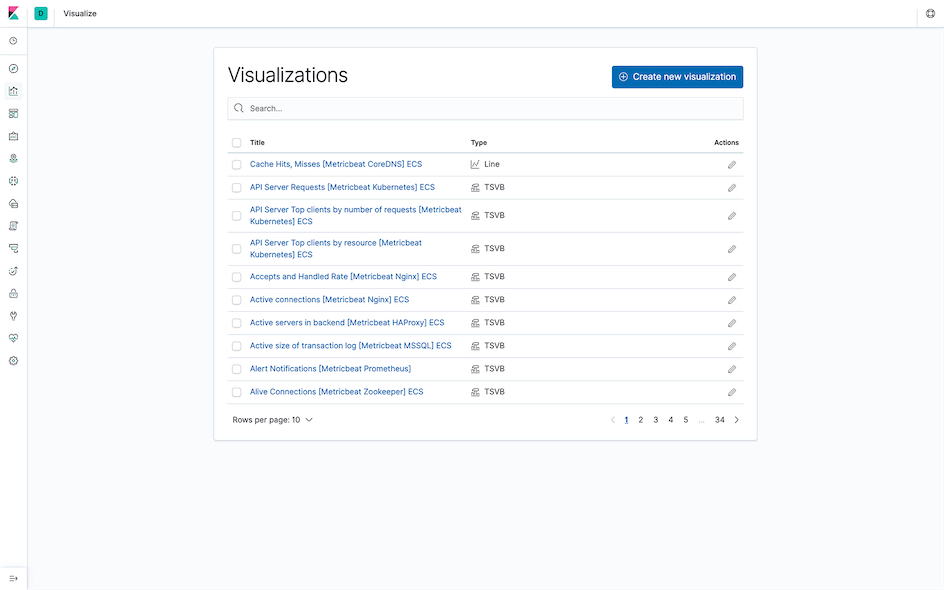
Visualize⌗
Create visualizations and aggregate data stored in Elasticsearch indices. The visualization cards created in this module will be used for centralized display in the Dashboard.
Dashboard⌗
Manage data visualization components and filtered search results from Discover.
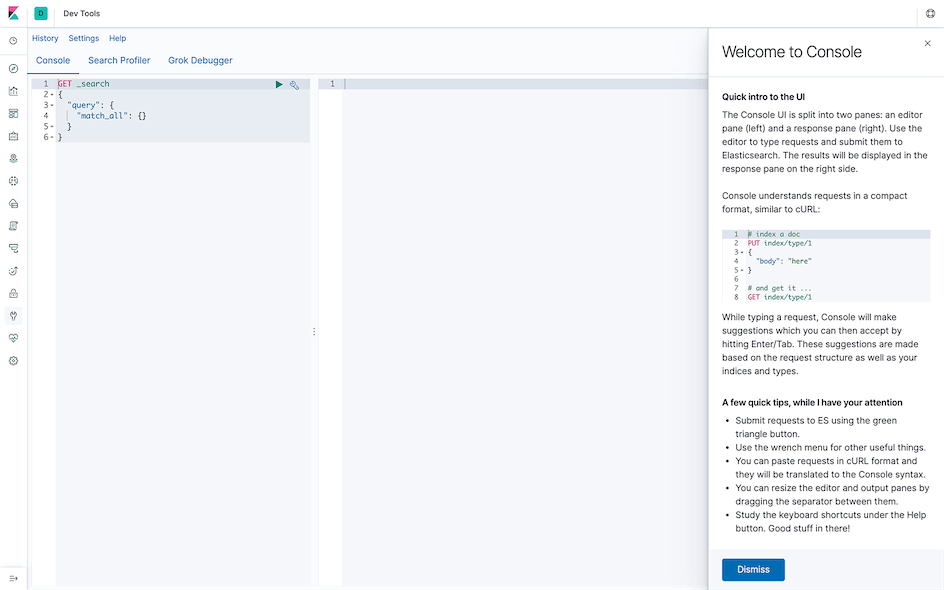
Dev Tools⌗
Used for operating Elasticsearch with Elasticsearch query DSL.
Summary⌗
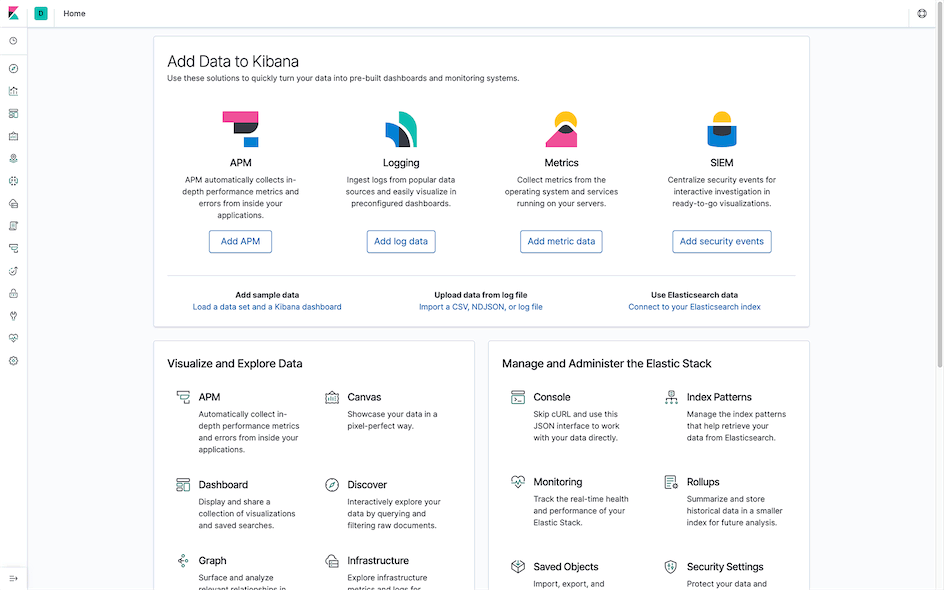
I’ve only listed the commonly used features here. You can browse and learn about others according to your needs by visiting the Kibana homepage.
I hope this is helpful, Happy hacking…