Install Kubernetes Dashboard

Install Dashboard⌗
After the Kubernetes cluster is initialized, we can install the Dashboard for visual management. Execute the following command to install:
kubectl apply -f https://raw.githubusercontent.com/kubernetes/dashboard/v2.7.0/aio/deploy/recommended.yaml
Authentication⌗
Create a service account and cluster role binding configuration file:
cat > dashboard-adminuser.yaml << EOF
apiVersion: v1
kind: ServiceAccount
metadata:
  name: admin-user
  namespace: kubernetes-dashboard
---
apiVersion: rbac.authorization.k8s.io/v1
kind: ClusterRoleBinding
metadata:
  name: admin-user
roleRef:
  apiGroup: rbac.authorization.k8s.io
  kind: ClusterRole
  name: cluster-admin
subjects:
- kind: ServiceAccount
  name: admin-user
  namespace: kubernetes-dashboard
EOF
Apply the configuration file:
kubectl apply -f dashboard-adminuser.yaml
Set Dashboard Exposure Method⌗
By default, the Dashboard is exposed as a ClusterIP service, which is only accessible within the cluster. To access it from outside the cluster, we need to modify the service type to NodePort:
kubectl -n kubernetes-dashboard edit service kubernetes-dashboard
Find the type: ClusterIP line and change it to type: NodePort, then save and exit.
Check the exposed port:
kubectl -n kubernetes-dashboard get service kubernetes-dashboard
NAME                   TYPE       CLUSTER-IP     EXTERNAL-IP   PORT(S)         AGE
kubernetes-dashboard   NodePort   10.96.61.101   <none>        443:30093/TCP   23m
As shown above, the Dashboard is exposed on port 30093.
Get Token⌗
Execute the following command to get the token for logging into the Dashboard:
kubectl -n kubernetes-dashboard create token admin-user
eyJhbGciOiJSUzI1NiIsImtpZCI6IkRBNWNTRnZCZzZJUXVmMnVkMEtQX0FKVDVMZWRLTnZhTTdMYkw1ZFh6X28ifQ.eyJhdWQiOlsiaHR0cHM6Ly9rdWJlcm5ldGVzLmRlZmF1bHQuc3ZjLmNsdXN0ZXIubG9jYWwiXSwiZXhwIjoxNjY0ODU5NTc3LCJpYXQiOjE2NjQ4NTU5NzcsImlzcyI6Imh0dHBzOi8va3ViZXJuZXRlcy5kZWZhdWx0LnN2Yy5jbHVzdGVyLmxvY2FsIiwia3ViZXJuZXRlcy5pbyI6eyJuYW1lc3BhY2UiOiJrdWJlcm5ldGVzLWRhc2hib2FyZCIsInNlcnZpY2VhY2NvdW50Ijp7Im5hbWUiOiJhZG1pbi11c2VyIiwidWlkIjoiNzJhMzZkMzQtNDM5Zi00YjA3LWI1YTMtMjJkMDg2YzI1YzM3In19LCJuYmYiOjE2NjQ4NTU5NzcsInN1YiI6InN5c3RlbTpzZXJ2aWNlYWNjb3VudDprdWJlcm5ldGVzLWRhc2hib2FyZDphZG1pbi11c2VyIn0.Xt9Ahh7kKKK-SLrLpOXdWGG9qZFYdKYUQUFYEUbaDsMQCaDMPSQwoz9OYbvsAGGtQKstO7B3TJjbLHFRPLQzQELrPKbIxjL7jrLBWKTGf-zyYBvj-GBNJ-VBvRjvWEG_NbNtKBfaIQrZJF7QRLcbKqQTJYJ5rj7Kyzr_ZFTBJxrBJLNp-KIvp5x6G0HRRbYQ5AxPOvYvMXJLz_sfQYQMh8Fmj-Jj7TKsaLQZIDBKBmTJGWRQDnESo_GEPW3yUzHHQMcTQqHyeKLTwYDxCjXHlg9IYc9nWYIXZ_uLsKzjZASMQXjQ_hJ_xYCGKD-xYvUzQO-Jj9Fz-5XTvZnZQA
Access Dashboard⌗
Now you can access the Dashboard through the browser using the following URL:
https://<node-ip>:30093
Replace <node-ip> with the IP address of any node in your cluster. Since the Dashboard uses HTTPS with a self-signed certificate, you’ll need to accept the security risk in your browser.
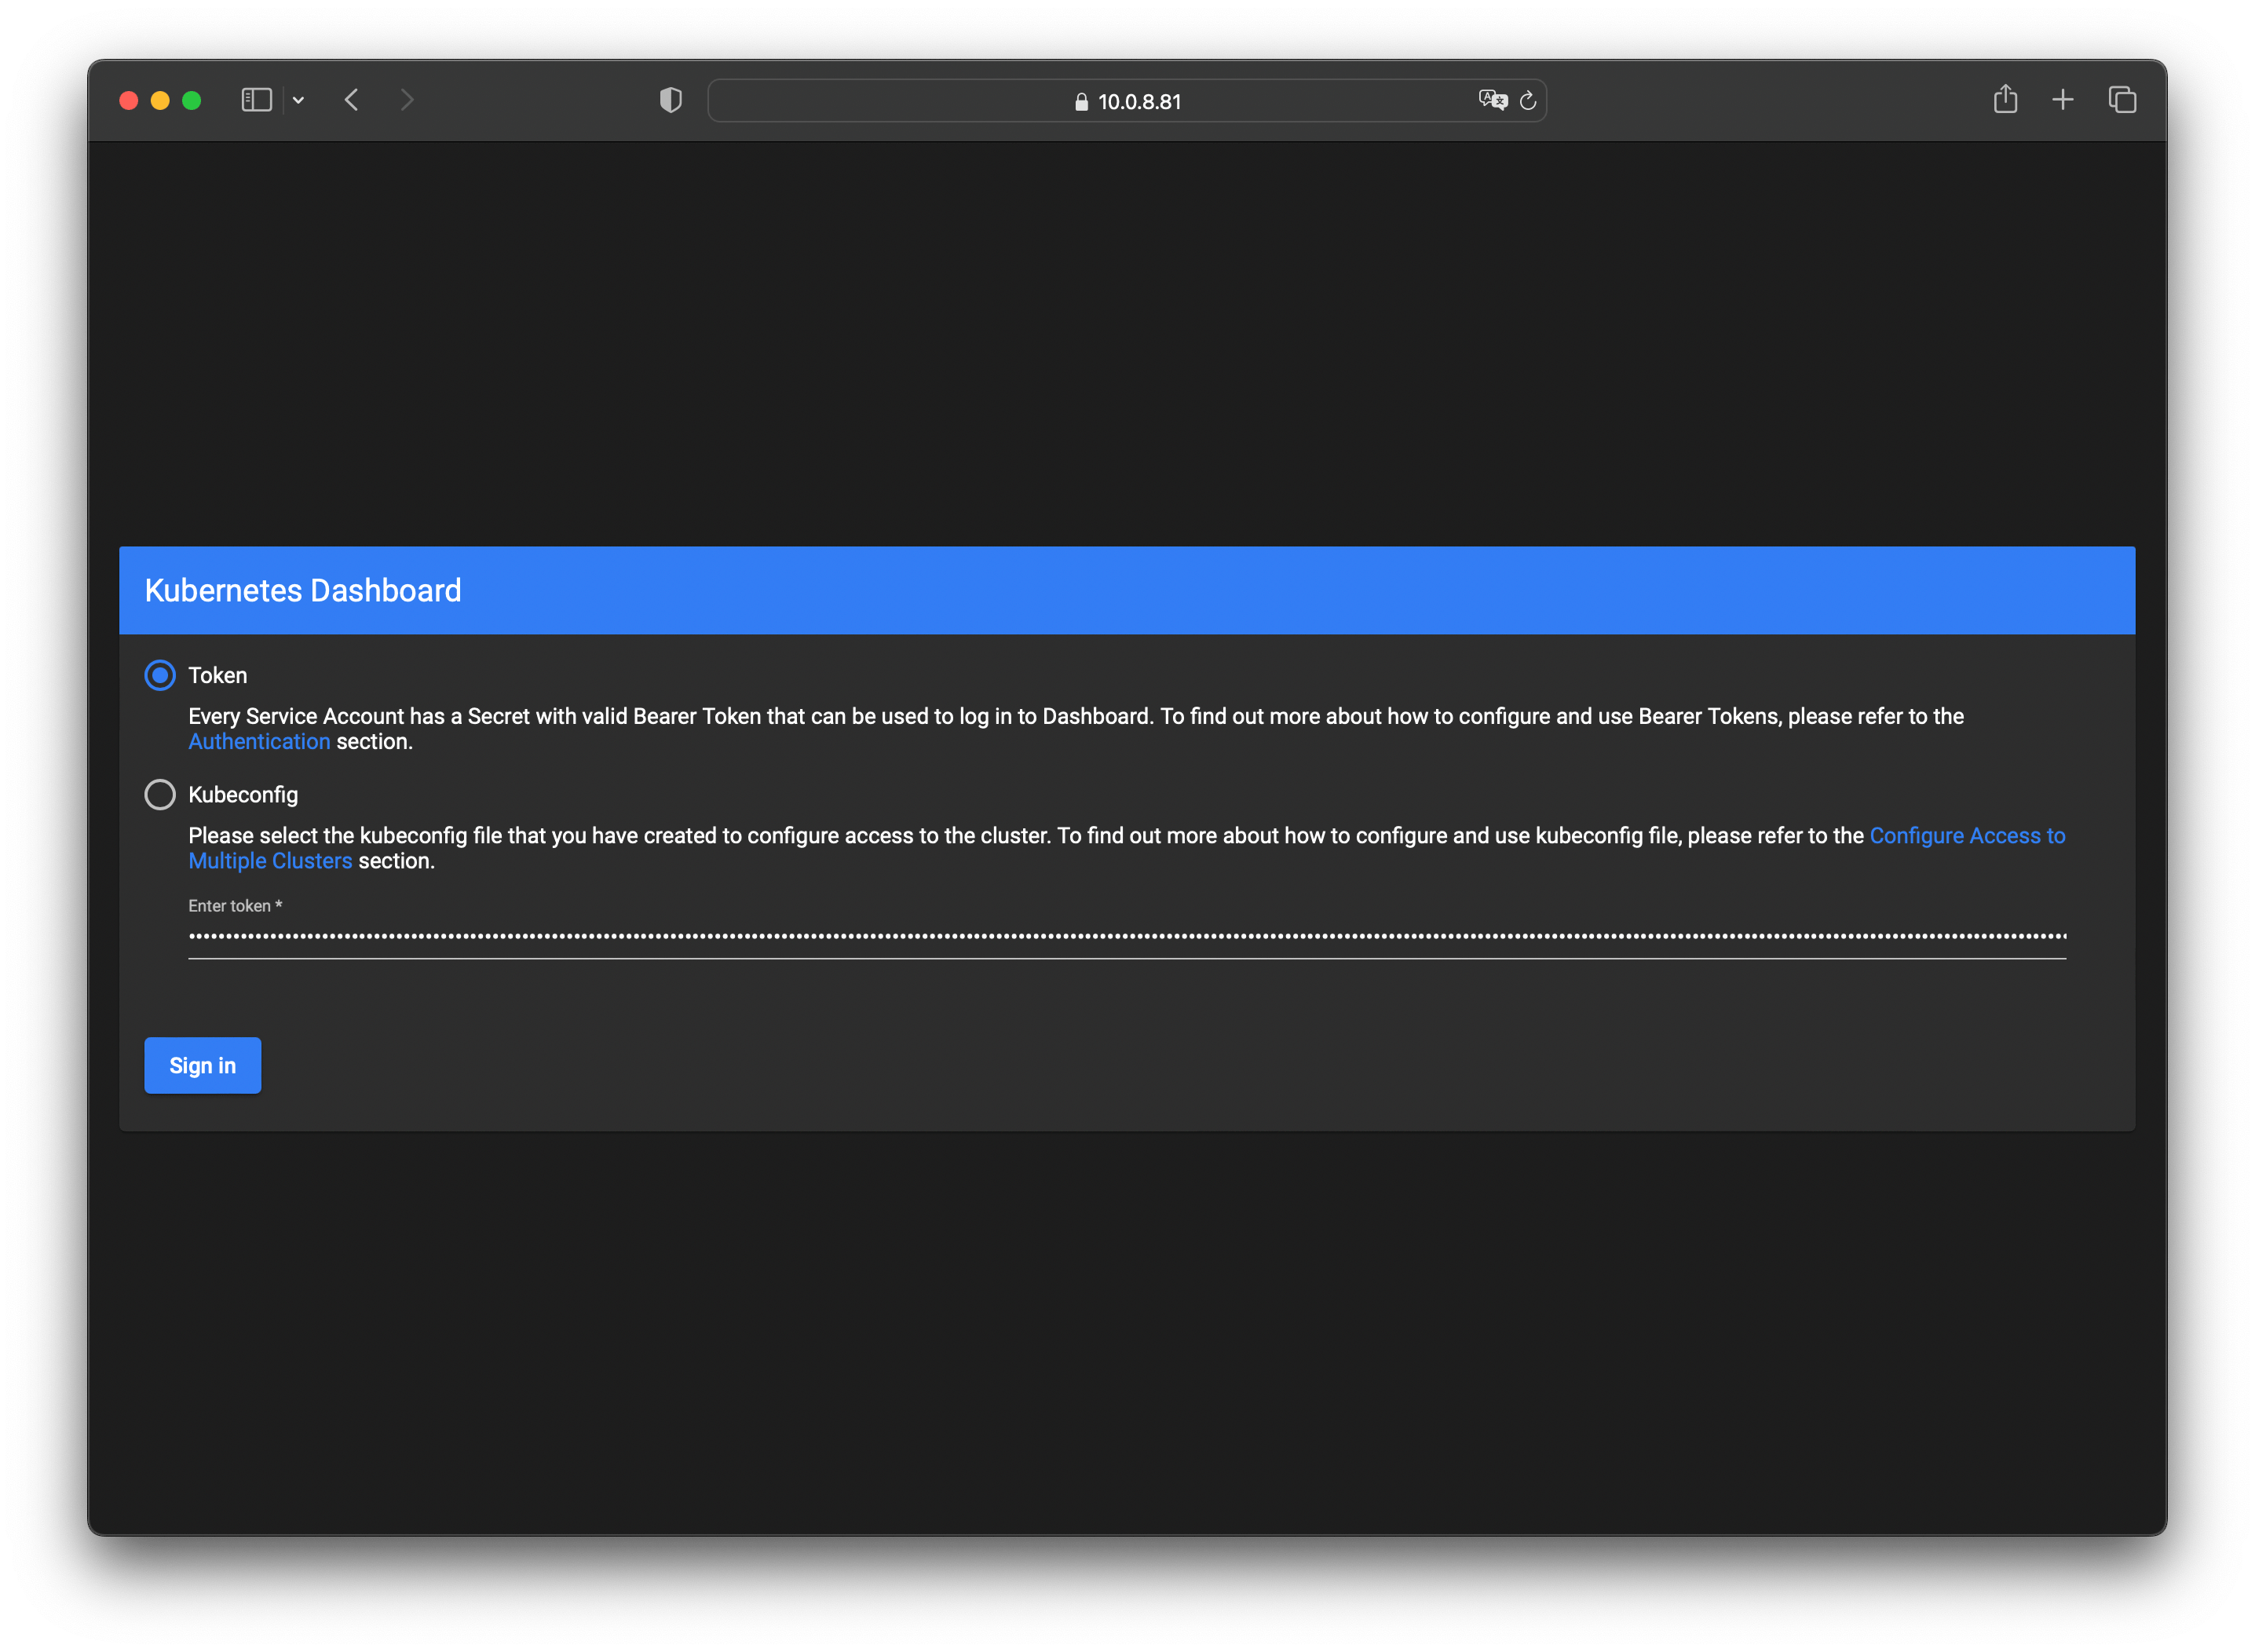
Enter the token obtained in the previous step to log in:
After logging in, you’ll see the Dashboard interface:
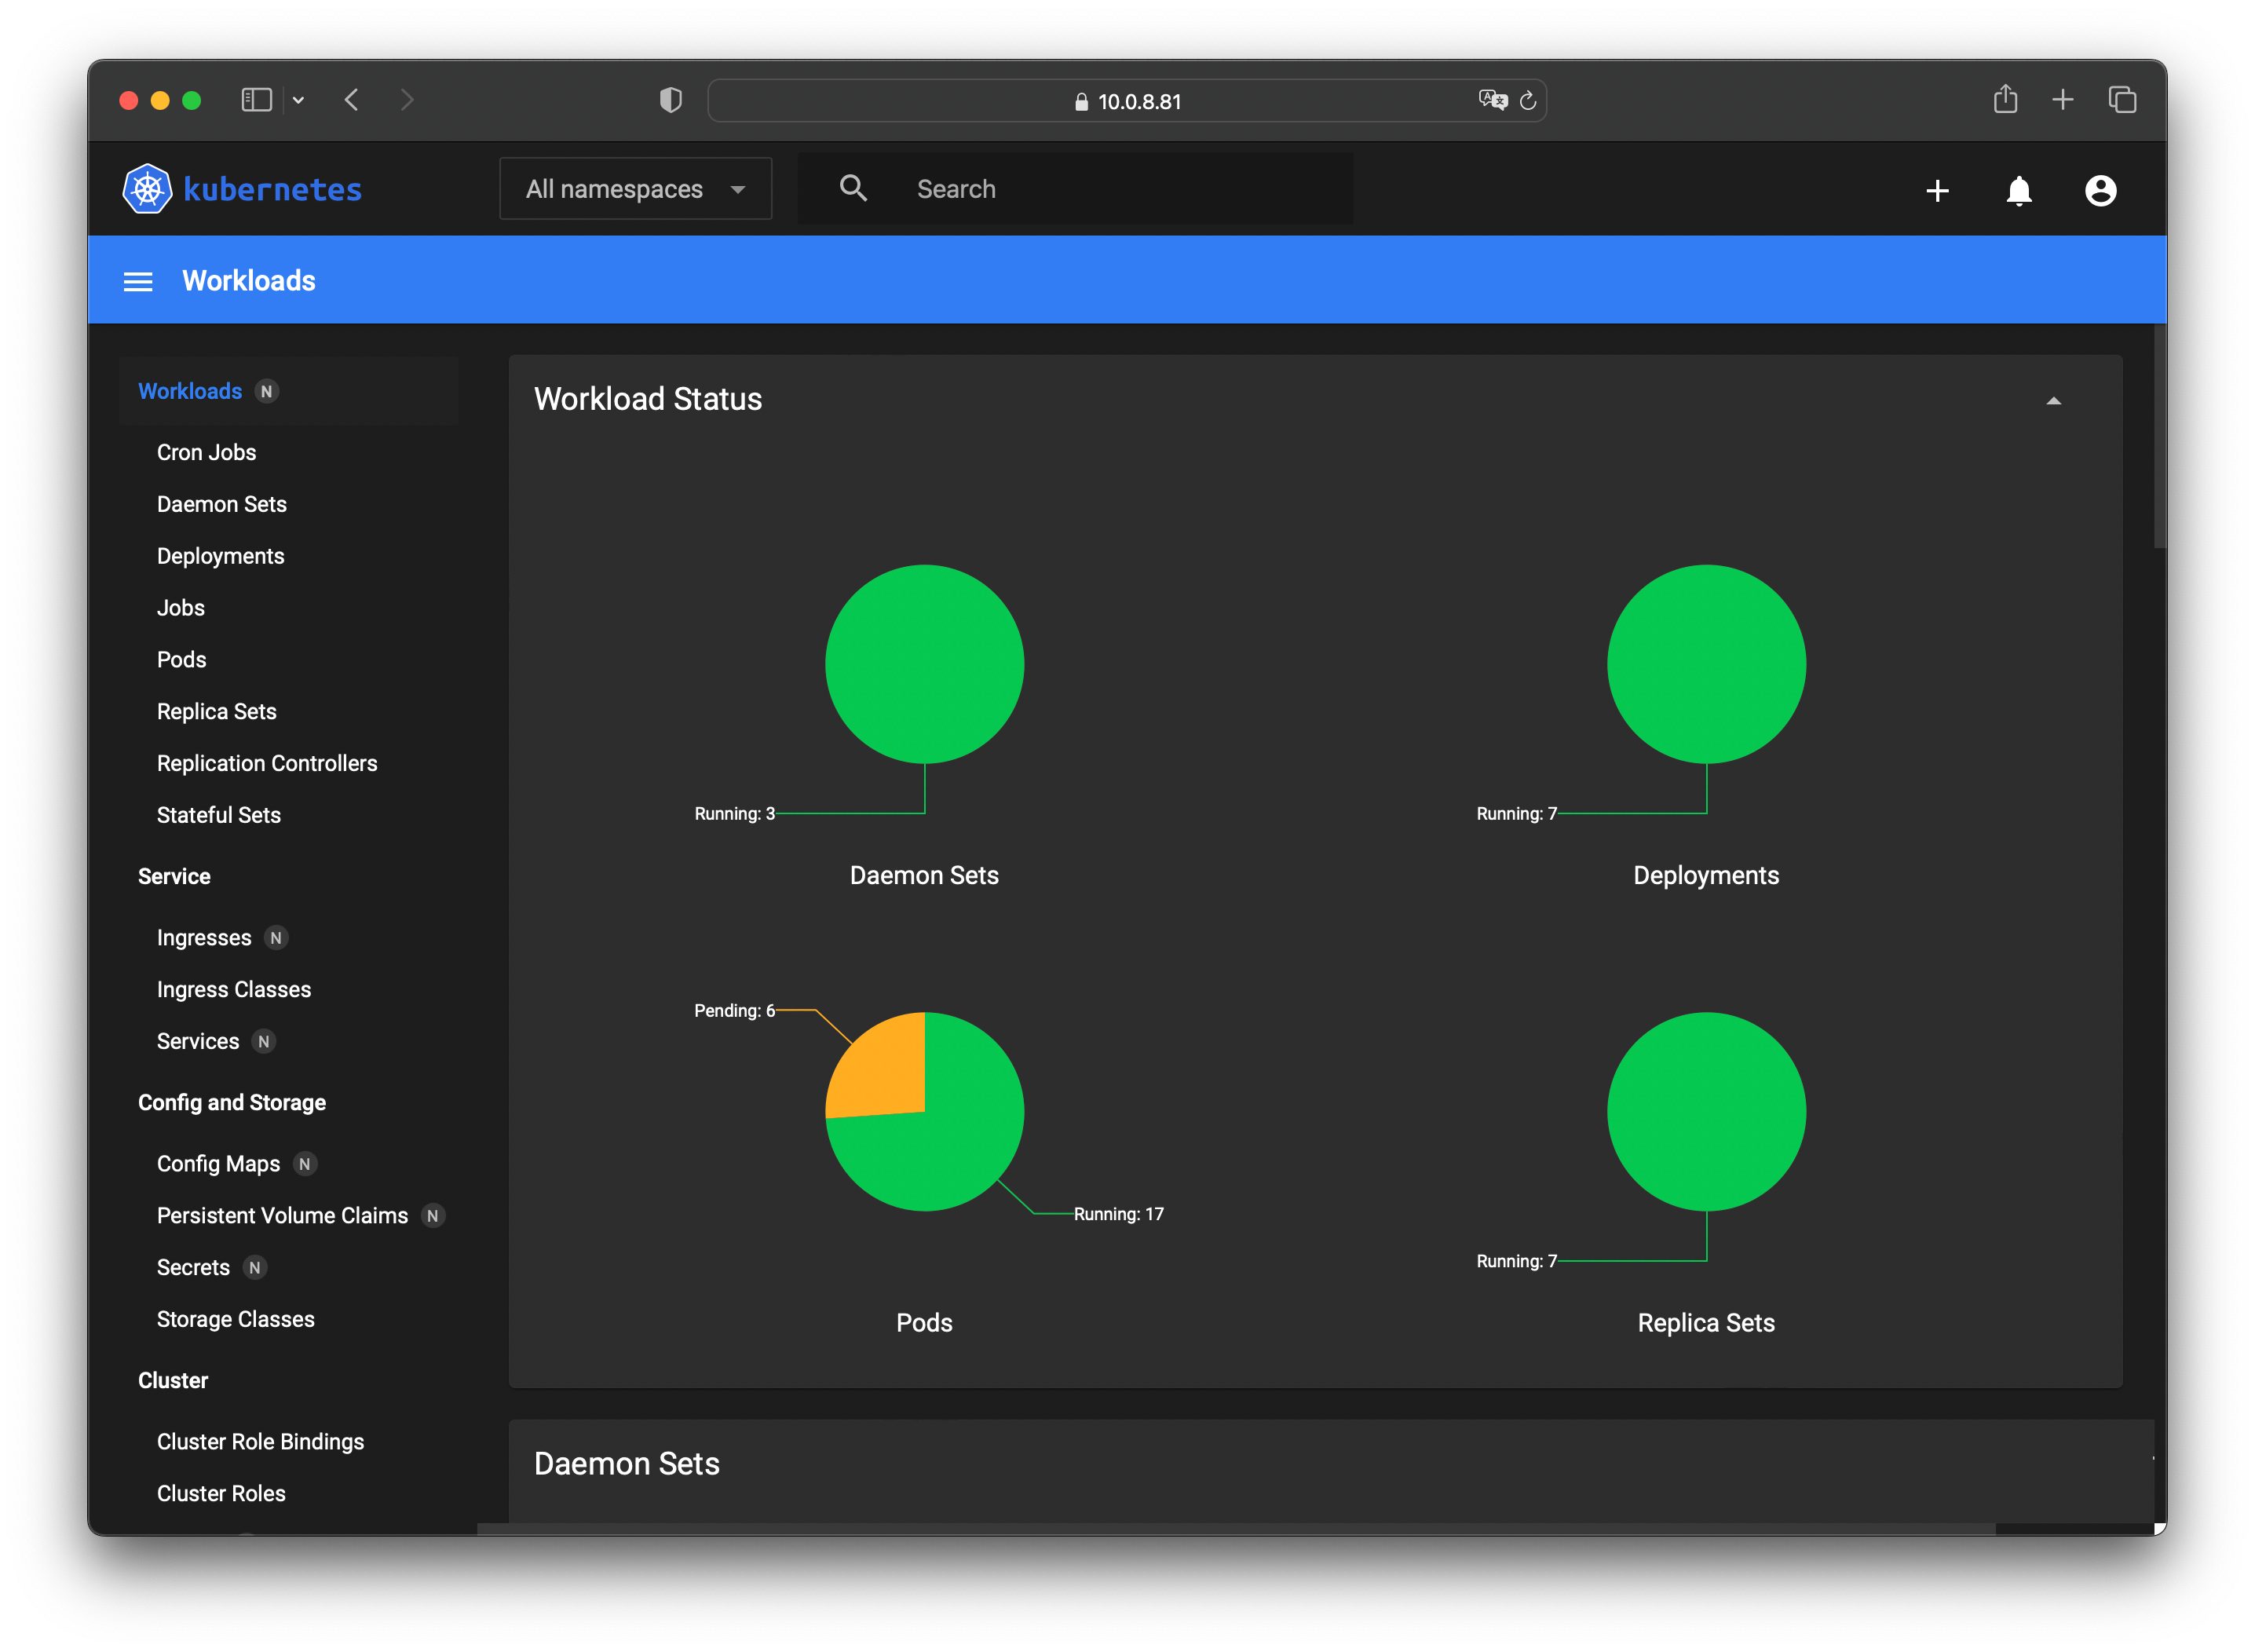
Now you can manage your Kubernetes cluster through this visual interface.
I hope this is helpful, Happy hacking…